Under heavy development by h4ck1ng.scienceReal-time collaborative canvasGeo-anchored cursors and presencePMTiles, COG, GeoParquet, GeoJSON, ZarrData read in place over HTTP range requestsDrop-to-clip: vectors filtered, rasters maskedGeodesic measurements and pinned notesShared timeline and sequencerSpatial SQL in the browser on DuckDB-WASMSPARQL layers3D modeMCP and Python agents, free on every planOffline-firstSelf-hostableNo telemetryUnder heavy development by h4ck1ng.scienceReal-time collaborative canvasGeo-anchored cursors and presencePMTiles, COG, GeoParquet, GeoJSON, ZarrData read in place over HTTP range requestsDrop-to-clip: vectors filtered, rasters maskedGeodesic measurements and pinned notesShared timeline and sequencerSpatial SQL in the browser on DuckDB-WASMSPARQL layers3D modeMCP and Python agents, free on every planOffline-firstSelf-hostableNo telemetry
Everything here happens in a browser tab: no account, no install, nothing
to configure. In about five minutes you will have a room open, a colleague on it, data on the
map and a shape drawn around the bit you care about. Every step says what to do on a computer
and what to do on a phone, because they are genuinely different.
Open the canvasOpens a new room. Keep it beside this page and do the steps as you read.
Step 1
Open a room
Go to canvas.driades.app.
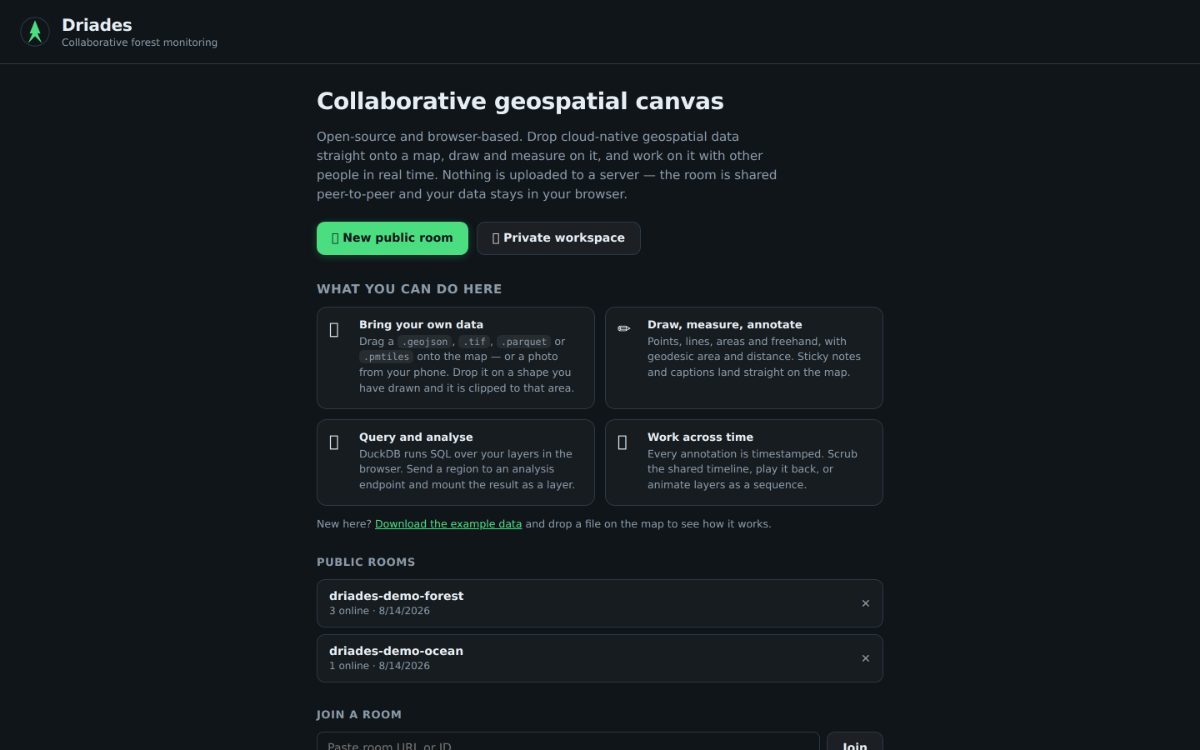
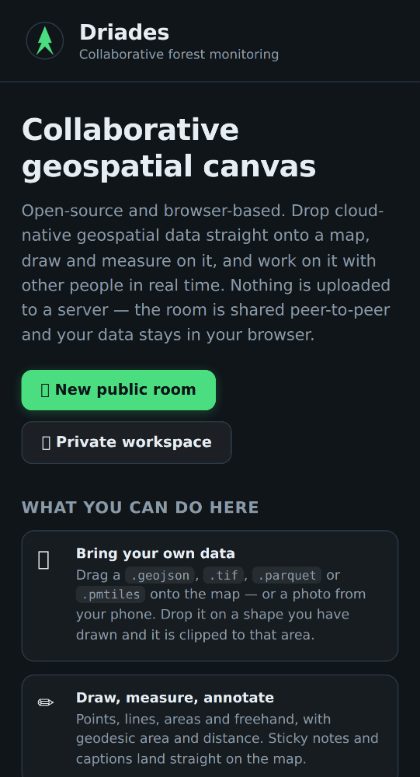
You land on a start screen with two buttons: 🌲 New public room makes a
room anyone with the link can open, and 🔒 Private workspace keeps it to
you. Below them is a list of public rooms already running, and a field to paste a room link
into. No account either way.
Where you land, on a laptop and on a phone. Press New public room to begin.
Once you are in, the room's name is the part of the address after the #, something
like #driades-ba4580f7. Everything you do next lives in that room: drawings, notes,
layers, the timeline.
You also get an identity for the session — an adjective and a tree, say Swift Oak,
with a colour of its own. That is what your collaborators will see moving around.
A new room opens on satellite imagery, so you start from what is actually
on the ground. The 🗺 control changes the backdrop, and that choice is
shared with the room — switch to terrain and everyone's canvas follows.
Step 2
Share it with someone
Press Share room in the room panel. It copies the full address to
your clipboard. Send that to anyone: opening it puts them in the room. There is no invitation
to accept and no permission dialog — the link is the access.
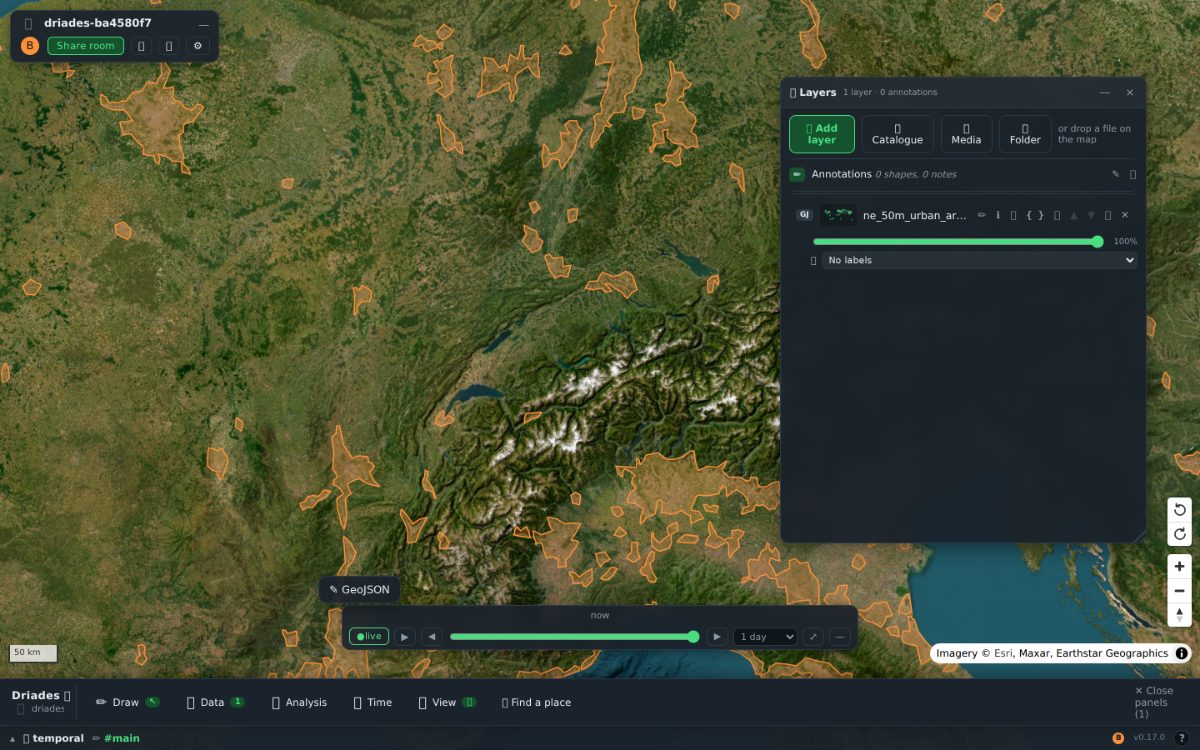
A room with one layer on it. Share room is top-left; the
layer stack is on the right; the timeline and the tool bar run along the bottom.
On a computer
The room panel sits top-left, with everyone's avatar in it. Click an avatar to fly with
that person — your map follows theirs until you touch your own map, which breaks the
follow instantly.
On a phone
The same panel is there, and it minimises to give the map the screen back. Your finger
position is broadcast as your cursor, so people watching on a laptop can see where you
are pointing.
Try it with two windows before you try it with a person: open the copied
address in a second window and drag a shape in one. It moves in the other.
Step 3
Move around
The map is the whole screen, so navigation is the first thing worth getting comfortable with.
To do this
On a computer
On a phone
Pan
Drag with the left button
Drag with one finger
Zoom
Scroll wheel, or double-click
Pinch, or double-tap
Rotate
Right-drag, or hold Ctrl and drag. The rotate buttons
turn 30° at a time and the compass snaps back to north
Twist with two
fingers; tap the compass for north
Tilt into 3D
Same right-drag, upward — or the 3D button, with an
exaggeration slider
Drag two fingers up the screen
Walk through it
🚶 Walk swaps dragging for game
controls: WASD to move,
QE to turn, RF up and down,
Shift to sprint, Esc to leave
Not a touch mode — it
needs a keyboard
Rotating and tilting change your view only. Nobody else's map
turns, and the data itself never moves — same as choosing a layer's opacity.
Step 4
Put data on the map
Driades reads cloud-native formats where they sit — usually with a few HTTP range requests,
so a continent-scale archive costs you the tiles in view and nothing else. There is no import
step and no upload.
On a computer
Drag a file onto the map. One or several, or a URL dragged as text. The
drop overlay appears; let go anywhere.
On a phone
Use + Add layer in the layer panel, or
+ Import dataset… in the gallery — a phone has no drag and drop,
so these are the same thing through a file picker.
Either way, two more routes work everywhere:
Paste a URL into the field in the 🗂 layer panel
and press Enter. URL layers are shared with the room, so everyone loads the same thing.
The 🌍 catalogue, next to
+ Add layer: a shelf of curated public datasets — borders, regions,
cities, rivers, lakes — each with its size, source and licence. One tap mounts it.
The 📚 gallery lists every file anyone in the
room has dropped, streamed peer-to-peer. +map puts one on your map.
Formats it will take: .pmtiles, .tif and .tiff
(Cloud-Optimized GeoTIFF), .parquet and .geoparquet,
.geojson and .json, ordinary images, and .zarr stores
by URL. Anything else is refused with a message rather than mounted invisibly.
Draw first to clip. If you draw an area and then drop a
file onto that shape, the layer arrives clipped to it: vectors are filtered to the
shape, rasters are pixel-masked to the polygon.
Step 5
The layer stack
The 🗂 panel is a stack in the image-editor sense. Each row has an
opacity slider and a 👁 visibility toggle, rows reorder, and the
order is what you see on the map.
On a computer
The panel sits on the right. Right-click a row for the rest: rename, zoom to it, isolate
it, remove it.
On a phone
Swipe in from the right edge of the screen to open it. Press and hold a
row for half a second to get the same menu a right-click gives — that is the touch
equivalent, not a reduced version of it.
Layers you add are shared with the room, along with where they came from: description,
attribution, licence and source URL travel with the layer, so a collaborator who never opened
the catalogue still sees what they are looking at.
Step 6
Draw, annotate, measure
The toolbar holds ✋ Pan, ⬚ Select,
📍 Point, 〰 Line,
⬠ Area, ▭ Rect,
✏️ Free and 📝 Note. On a computer it runs
down the left side; on a phone it docks along the bottom with targets big enough for a thumb.
Everything you draw is geo-anchored and streams as you draw it — collaborators see the shape
forming, not just the finished object. Sticky notes are editable by two people at once.
To measure something, switch back to ✋ Pan and click
or tap the shape: a chip gives its geodesic area and perimeter. Give it a name and the name
travels with the document.
Step 7
Move through time
The slider along the bottom is the room's shared timeline. ● live
shows everything; drag back and the canvas replays how the room's picture was built. Data with
dates in it — a tree inventory with planting years, say — lights the slider up on drop.
Querying is not only SQL. Spatial SQL runs over your loaded layers with
DuckDB in the browser, and SPARQL runs against any endpoint — Wikidata, your
own store, or a graph published as a
.rete
file. Both land their results back on the canvas as layers; see
working with .rete graphs.
Two things sit next to it. The 🎞 sequencer plays stacks of imagery
as a flipbook, blended, or as a true per-pixel mean. And pulling up the footer bar gives you
temporal channels: choose whether you are co-editing one timeline with
someone or just following theirs, read-only.
What is different on a phone
Not a cut-down version — the same room, the same document, the same people. What changes is
how you reach things:
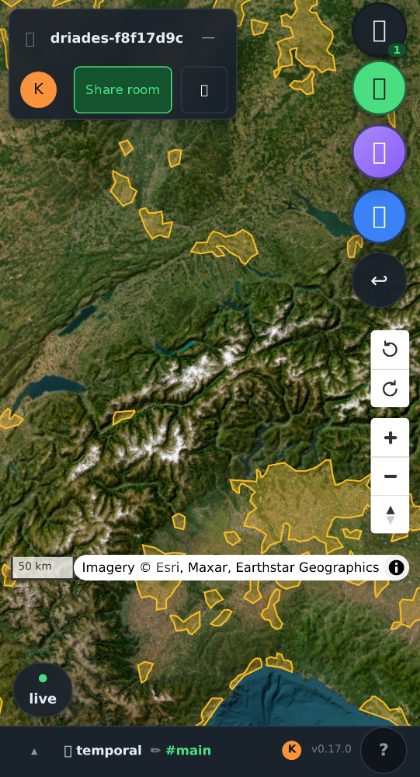
The same room on a phone: tools become round buttons down the right edge, and the
panels open over the map instead of beside it.
The toolbar docks to the bottom, with 44px targets, and the layer panel collapses out of
the way.
Swipe in from the right edge for layers, from the left edge
for your account. The swipe only counts if it starts within about 32px of the edge, so the
rest of the screen still belongs to the map.
Press and hold for half a second wherever you would have right-clicked.
Two fingers twist to rotate and drag up to tilt.
Your finger position is your presence cursor, so people on laptops can follow what you
are pointing at.
Drag and drop does not exist on a phone; use + Add layer, the
🌍 catalogue, or the 📚 gallery instead.
Working with .rete graphs
A .rete
file is a self-describing knowledge graph: its header points at every section, and a dataset
card inside it records who made it, the licence and the counts — so a reader can introduce the
file over two HTTP range requests without ever downloading the graph. The
historical atlas in our trees is one of these, read live in a
browser.
You cannot drop a .rete file onto the canvas. It is not one of
the formats the map reads, and dropping one gets you "Unsupported file type". What Driades
does instead is meet rete at the point where a graph becomes geography — a query result — and
there are three ways in.
Run a SPARQL query as a layer
In the 🗂 panel, open ▸ SPARQL query, give it
an endpoint and a query, and press ▶ Run as layer. Each row becomes a
point feature, and the layer arrives with an SPQ badge.
Coordinates are found in the bindings: a Point(x y) WKT literal first — which is
what Wikidata's wdt:P625 gives you — otherwise variables named
?x/?lng/?lon/?long/?longitude
and ?y/?lat/?latitude. A third value or a
?z/?elev/?alt/?height variable becomes
elevation, and ?t/?date/?year/?inception
and friends make the layer follow the shared time slider — bare years included. Every other
binding rides along as a feature property.
The query is what gets shared, not the results. The endpoint and
the query text go into the room's document and every peer runs them again, so nobody is
streaming a graph to anybody. If the endpoint refuses a GET, Driades retries as a form POST.
Hand it a link
Any page — an atlas, a notebook, a dashboard — can push data in by linking:
?layer= repeats, so several layers can arrive at once. The parameters are
self-consuming: once imported they are stripped from the address bar, so reloading — or
sending the room link to a colleague — does not import everything a second time.
Push from a node editor, live
If your pipeline lives in a rete node editor, embed Driades in an iframe or open it in a
popup and post to it as the graph changes:
You get exactly one answer back — driades:layer-added with the name, or
driades:error with a message. Inline GeoJSON goes through the same path as a
dropped file, so z coordinates survive and time-ish properties still light up the
slider.
Where next
This page is the short version. The full reference covers clipping, the dataset library,
spatial SQL in the browser, SPARQL layers, the sequencer, analysis jobs, the agents API and
self-hosting. Every page is also published as markdown, which is what the knowledge MCP
reads.
Stuck? The ? button at the end of the footer bar
opens the in-app quick guide, which is the same information without leaving the map.
Ask an assistant instead
If you would rather ask than read, the project answers questions directly inside ChatGPT and
Claude. It speaks the Model Context Protocol at https://driades.app/mcp and it
knows the dataset catalogue, the trees, every page of these docs, and SQL over all of it.
There is no key and no account. Everything it can reach is already published on this site,
and every tool on it is read-only, so the worst it can do is tell you about a dataset.
ChatGPT
Connectors are a Plus, Pro, Business, Enterprise or Edu feature, and they are set up on
the web rather than in the mobile app.
Open Settings → Apps & Connectors → Advanced and turn on
Developer mode.
Back in Connectors, choose Create.
Paste https://driades.app/mcp as the URL, name it Driades, and set
authentication to No authentication.
Create it, then pick it from the + menu in a chat.
It also works as a source for deep research, where ChatGPT searches the catalogue and
then reads the entries it wants in full, citing the dataset it used.
Claude
One line in the terminal:
claude mcp add --transport http driades https://driades.app/mcp
In the Claude desktop and web apps, add it under
Settings → Connectors → Add custom connector with the same URL.
Anything else that speaks MCP takes the same URL. In a JSON config it is
{"type": "http", "url": "https://driades.app/mcp"}.
Useful things to ask it: which datasets cover canopy height, and what are their
licences? · what is in the Spanish protected areas file? · how do I clip a
raster? · count the datasets by licence.
This is the reading half. There is a second MCP server that can act on a
canvas — draw, drop notes, add layers, scrub time — which is covered in the agents API page
of the full documentation.