Under heavy development by h4ck1ng.scienceReal-time collaborative canvasGeo-anchored cursors and presencePMTiles, COG, GeoParquet, GeoJSON, ZarrData read in place over HTTP range requestsDrop-to-clip: vectors filtered, rasters maskedGeodesic measurements and pinned notesShared timeline and sequencerSpatial SQL in the browser on DuckDB-WASMSPARQL layers3D modeMCP and Python agents, free on every planOffline-firstSelf-hostableNo telemetry

Open data, checked by hand

Datasets worth mounting

Open data you can read directly from a public host — Zenodo, Hugging Face, an S3 bucket, a SPARQL endpoint or a plain GitHub repository. Forest and protected-area layers to work with, Spain's protected areas in full, plus the sources behind the historical atlas tree. Every field comes from the dataset's own record, and where a record does not say something, the card says so instead of guessing.

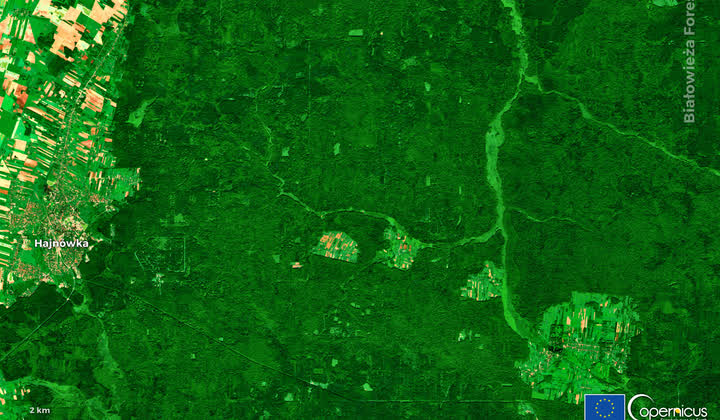
Sentinel-2 true-colour quicklook over the Białowieża Forest, Poland
The archive’s own quicklook for scene S2B_34UFD_20240828_0_L2A, 0.05% cloud, over Białowieża. © European Union, Copernicus Sentinel-2

AWS S3

Sentinel-2 L2A, cloud-optimized

The Sentinel-2 Level-2A archive rewritten as Cloud-Optimized GeoTIFFs, with a STAC API in front of it. Atmospherically corrected surface reflectance, so you can pull a single band over one forest instead of a whole granule.

Coverage
Global land
Revisit
5 days
Resolution
10 / 20 / 60 m by band
Format
COG + STAC JSON
Updated
Within hours of release
Licence
Copernicus free, full and open

s3://sentinel-cogs

us-west-2 · open bucket, no requester-pays

Tree coverShrubland / grasslandCroplandBuilt-upBare / sparse, snow & iceWater, wetland, mangrove11 classes · 10 m · 2020 & 2021
Class legend. ESA publishes no browse image for the tiles, so this is a legend rather than a render.

AWS S3

ESA WorldCover 10 m land cover

Eleven land-cover classes for the whole planet at 10 m, built from Sentinel-1 radar and Sentinel-2 optical data. The tree-cover class is the quickest honest forest mask there is.

Coverage
Global
Epochs
2020 (v100), 2021 (v200)
Resolution
10 m, EPSG:4326
Format
COG, 3°×3° tiles
Size
≈117 GB map layer, 2 651 tiles
Licence
CC BY 4.0

s3://esa-worldcover/v200/2021/map/

eu-central-1 · e.g. ESA_WorldCover_10m_2021_v200_N00E006_Map.tif

Attribution required when mapped: “© ESA WorldCover project 2020 / Contains modified Copernicus Sentinel data (2020) processed by ESA WorldCover consortium”.

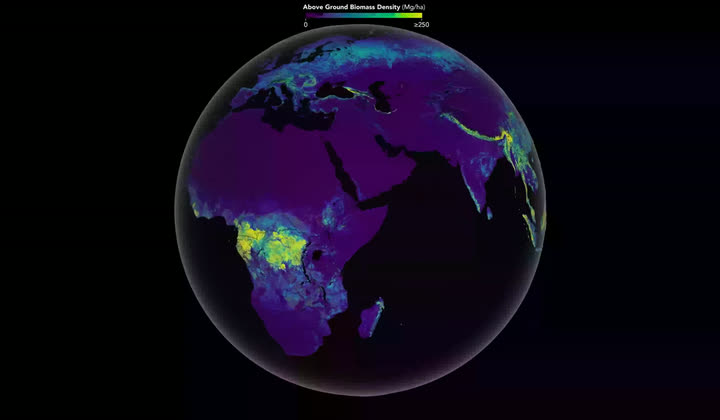
Global above-ground biomass density rendered as a globe, from GEDI and ICESat-2
Above-ground biomass density from GEDI and ICESat-2. NASA’s Scientific Visualization Studio, public domain

AWS S3

GEDI L4A footprint biomass, v2.1

Above-ground biomass density in Mg/ha for every GEDI laser footprint, with the prediction error for each one. Sampled shots along the ISS ground track rather than a wall-to-wall raster, which is exactly why it pairs well with a drawn area.

Coverage
ISS ground-track sampling
Units
Mg/ha + per-shot error
Geometry
Footprints, not a grid
Format
Granules by sub-orbit
Host
ORNL DAAC on AWS
Licence
NASA open data

s3://ornl-cumulus-prod-protected/gedi/GEDI_L4A_AGB_Density_V2_1/data

us-west-2 · protected bucket, needs a free NASA Earthdata login

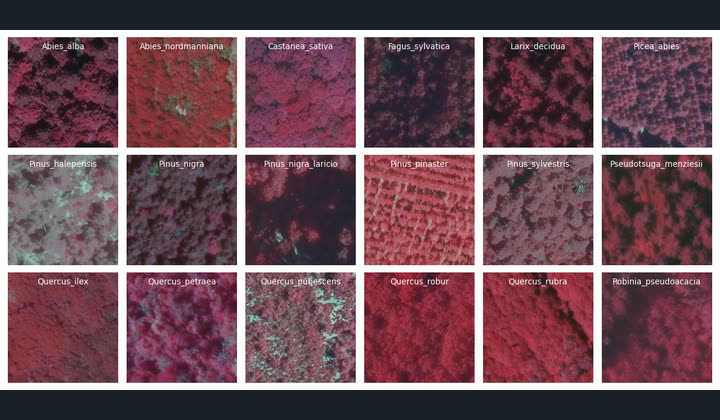
Grid of false-colour aerial patches, one per tree species, each labelled with its Latin name
One 0.2 m false-colour patch per species, from the dataset’s own card. IGN France, Open Licence 2.0

Hugging Face

PureForest

Monospecific forest patches labelled by species, each with both very-high-resolution aerial imagery and a dense Lidar point cloud over the same ground. A rare case of a species benchmark where the two modalities actually line up.

Patches
135 569 (69 111 / 13 523 / 52 935)
Classes
13 classes over 18 species
Imagery
0.2 m NIR-R-G-B, 250×250 px
Lidar
≈10 pulses/m² airborne
Extent
449 forests, 40 French departments, 339 km²
Size / licence
144 GB · Etalab Open Licence 2.0

hf://datasets/IGNF/PureForest

Also loadable with datasets.load_dataset("IGNF/PureForest")

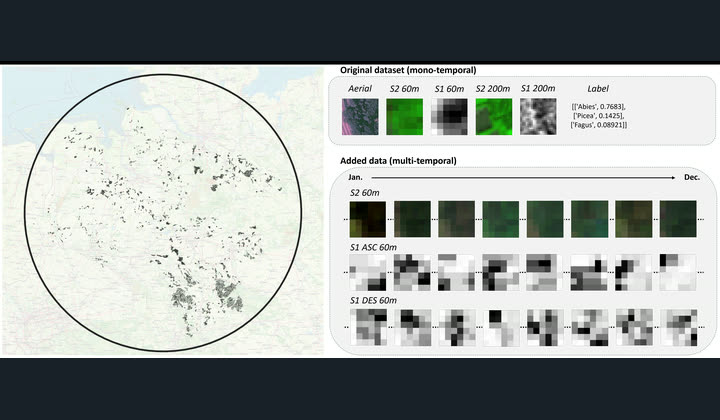
Figure from the TreeSatAI Time Series dataset card showing aerial, Sentinel-1 and Sentinel-2 samples
The dataset’s own overview figure. IGN France, CC BY 4.0

Hugging Face

TreeSatAI Time Series

Tree species labels for 60 m plots in Lower Saxony, each carrying a full year of Sentinel-1 and Sentinel-2 observations plus a 0.2 m aerial patch. Built for models that need to watch a stand change through a season.

Patches
50 381, 60 m × 60 m
Classes
20 species across 15 genera
Aerial
0.2 m RGB + near-infrared
Time series
Sentinel-1 VV/VH, Sentinel-2 10 bands
Coverage
Lower Saxony, Germany, from 2017
Size
22.8 GB

hf://datasets/IGNF/TreeSatAI-Time-Series

Licence: repo metadata says CC BY 4.0, the card text says CC BY-SA 4.0 — check before redistributing

0–5 m5–15 m15–25 m25–35 m35 m and overnon-forest / no dataheight in cm · 30 m grid · 2020
Height ramp. The Zenodo record carries no figure, so this is a legend rather than a render.

Zenodo

Global 30 m forest canopy height, 2020

A single global canopy height layer for 2020, fused from GEDI and ICESat-2 returns with Sentinel-1 and Sentinel-2 imagery in Earth Engine. Heights are stored in centimetres, so remember to divide.

Coverage
Global, WGS 84
Epoch
2020
Resolution
30 m
Format
305 ZIPs of 10°×10° GeoTIFF
Size
130 GB
Licence
CC BY 4.0

10.5281/zenodo.7643403

Nie, Zhu, Wang & Xi, 18 February 2023

wind / bark beetle complexfireharvestmixed agentsforest land useundisturbedagent classes · 1985–2023 · 38 countries
Agent classes. The record ships rasters only, so this is a legend rather than a render.

Zenodo

European Forest Disturbance Atlas, v2.1.1

Nearly four decades of European forest disturbance from the Landsat archive: when each patch was hit, how hard, how many times, and whether the cause was wind and bark beetle, fire or harvest. Country by country, so you can take just the one you work in.

Coverage
38 European countries, EPSG:3035
Period
1985–2023
Resolution
Not stated on the record (Landsat-derived)
Layers
Year, count, severity, agent, forest land use
Size
58.3 GB total · Germany 3.1 GB, Poland 3.2 GB, Sweden 6.4 GB
Licence
CC BY 4.0

10.5281/zenodo.13333034

Viana-Soto & Senf, TU Munich, 20 August 2024

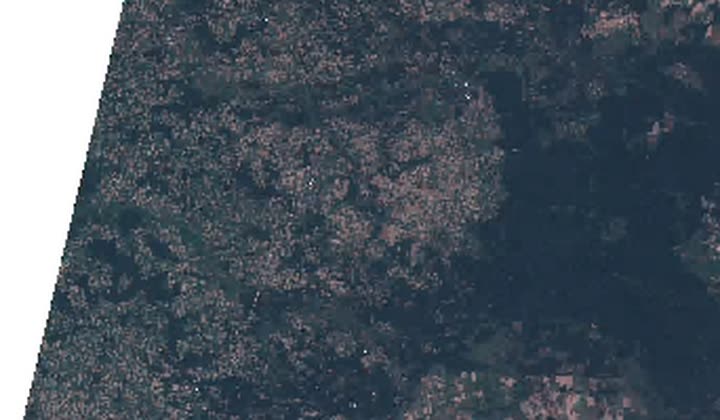
Copernicus Sentinel-2 false-colour image of the Białowieża Forest, Poland, the dark forest block standing out against farmland
Białowieża Forest, a Natura 2000 site straddling the Polish–Belarusian border. © European Union, Copernicus Sentinel-2, processed by DEFIS

EEA

Natura 2000 protected sites, end 2024

The boundaries of Europe’s protected-area network: every Special Area of Conservation and Special Protection Area, with the habitats and species each site was designated for. The layer to clip against when the question is “is this inside a protected site?”

Coverage
European Union
Version
End 2024, published Dec 2025
Geometry
Site polygons
Format
GeoPackage, Shapefile, WMS
Companion
Tabular habitats and species tables
Reuse
EEA terms, attribution — check the legal notice

https://sdi.eea.europa.eu/data/91357f39-7866-41ce-b447-43905c364ec8

Compiled by the European Commission, published through the EEA

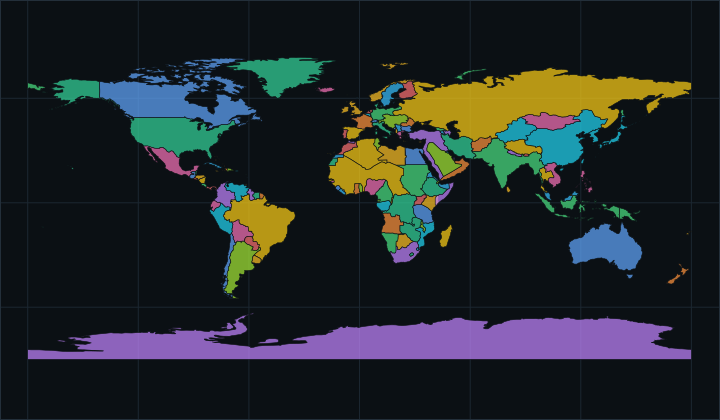
World map of 1914 drawn as filled country polygons on a dark graticule, from the dataset’s own GeoJSON
The 1914 file, drawn as it comes: 177 territories from world_1914.geojson, with nothing underneath them. aourednik/historical-basemaps, GPL-3.0

GitHub

Historical basemaps

Georeferenced boundaries of world countries and cultural regions, one GeoJSON per year, made for putting historical data on a map. This is the layer the atlas draws when you scrub the timeline: the 1914 world, then the 1938 one.

Coverage
World
Span
2000 BCE → 2010 CE
Format
GeoJSON, plus SVG conversions
Index
index.json lists every year and file
Extras
Draft historical places file
Licence
GPL-3.0

github.com/aourednik/historical-basemaps

The atlas embeds 18 of these snapshots. Author's own caveat: this is work in progress, historical boundaries are more disputed than modern ones, and you should check the maps against other sources before using them in academic work.

Base layer of the historical atlas

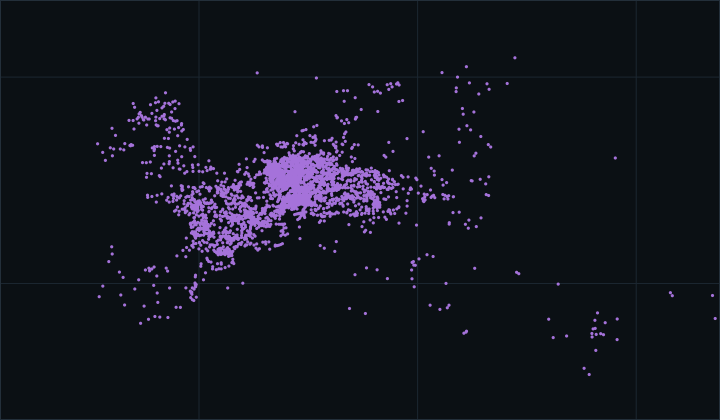
Scatter of 3,990 purple points concentrated over Europe, each a castle with coordinates in Wikidata
Every castle in one query, plotted where Wikidata says it stands — 3,990 of them, the query capped at 4,000. No basemap: the points are the picture. Wikidata, CC0

SPARQL

Wikidata

The free knowledge base, queried live rather than downloaded. Ask for every battle, castle, monastery or observatory with coordinates and a date, and you get a themed layer back — which is exactly how the atlas builds most of what you can switch on.

Coverage
Global, all periods
Access
Public SPARQL endpoint + dumps
Shape
Items with coordinates and dates
Formats
JSON, XML, CSV, TSV results
Cost
Free, no key, rate limited
Licence
CC0 1.0

https://query.wikidata.org/sparql

Point-in-time events keep one year; things that persist get a [start, end] lifespan, which is what lets a layer be filtered to the year under the playhead.

Conflict, disaster, built-heritage and institution layers in the historical atlas

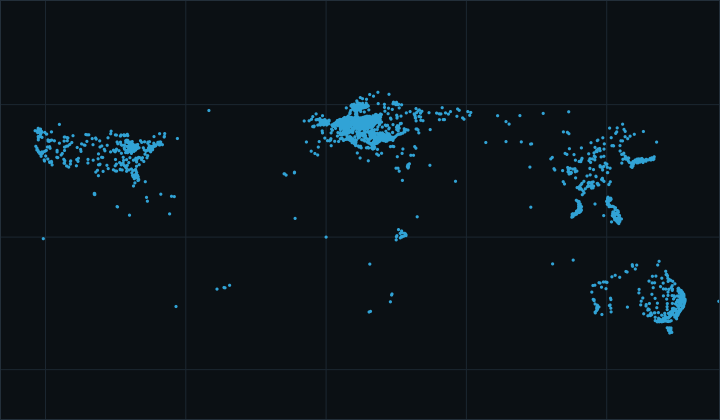
Scatter of 25,000 blue points clustered over the United States, Europe and Australasia
25,000 named features carrying a start_date, pulled through Overpass. The clusters are where the project has been mapped so far, not where history happened. © OpenHistoricalMap contributors, CC BY-SA

Overpass API

OpenHistoricalMap

OpenStreetMap with a time dimension: the same editing model and tags, plus start_date and end_date, so a feature can appear and disappear as you move through history. Real geometry, not dots — historical boundaries come back as polygons and routes as lines.

Coverage
Global, community mapped
Size
≈3.6 M dated elements
Contributors
≈2 200
Access
Overpass, planet dumps, vector tiles
Dating
start_date / end_date tags
Licence
CC BY-SA 2.0

https://overpass-turbo.openhistoricalmap.org

Planet dumps at planet.openhistoricalmap.org if you would rather hold the whole thing than query it.

Dated OSM features in the historical atlas

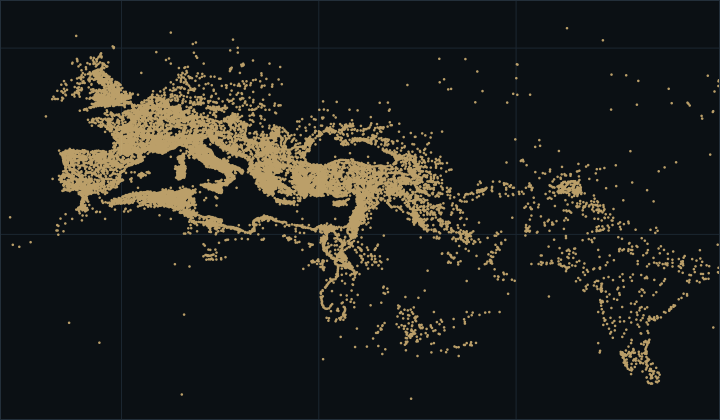
Sand-coloured points tracing the Mediterranean coastline, Anatolia, the Nile and the Roman road network
Every Pleiades place that has a location: 34,797 of the 42,400 records. Nothing is drawn but the places, and the Roman world traces itself. Pleiades, CC BY 3.0

Direct download

Pleiades ancient places

The community gazetteer of the ancient world: settlements, roads, temples and regions from classical antiquity, each with a stable URI, a location and a date range. The reference layer for anything happening before the map had countries.

Coverage
Ancient world, Mediterranean-centred
Formats
JSON, CSV, KML, RDF/Turtle, GeoJSON
Updated
JSON, CSV and KML daily; RDF weekly
Releases
Quarterly archival versions, latest 4.1 (28 May 2025)
Archived at
GitHub and Zenodo
Licence
CC BY 3.0

https://pleiades.stoa.org/downloads

Take the numbered quarterly release if you need a citable version; the daily exports move under you.

Ancient-places layer in the historical atlas

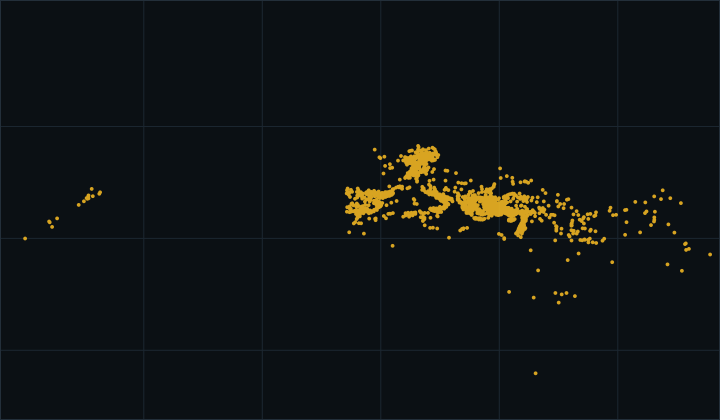
Gold points across the Mediterranean and Near East, each an ancient mint
2,195 mints, straight off the SPARQL endpoint, each at the place its coins were struck. Nomisma.org, licences vary by contributing dataset

SPARQL

Nomisma.org

Linked open data for numismatics, pooled from museums and collections across the world: coins, hoards, dies and monograms, tied to the mints and places they came from. Plot coin types at their mints and you get trade and power drawn on a map, deep into BCE.

Coverage
Greek, Hellenistic, Roman, medieval
Volume
600 000+ objects across contributing datasets
Formats
RDF/XML, Turtle, JSON-LD
Access
Public SPARQL endpoint
Modelling
Concepts with stable URIs, reused by partners
Licence
Varies by dataset

https://nomisma.org/sparql

There is no single licence for the whole of Nomisma. Contributing institutions keep their own terms, which run from ODbL through CC BY and CC BY-SA to CC BY-NC-SA — check the dataset you actually query.

≈10 k coin types at their mints in the historical atlas

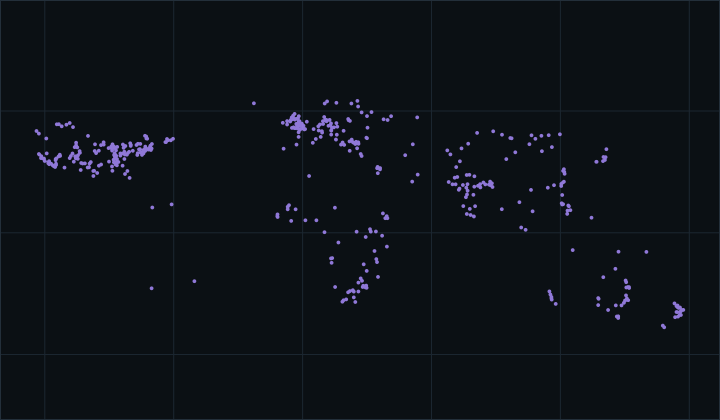
Violet points spread across every continent, each a power station with coordinates
1,500 power stations with coordinates, the query capped at 1,500. DBpedia, CC BY-SA 3.0

SPARQL

DBpedia

Wikipedia's infoboxes turned into a queryable graph. Useful as a second opinion: ask a second endpoint the same GeoSPARQL question you asked the first, and see whether the two agree on where and when something happened.

Source
Structured extraction from Wikipedia
Access
Public SPARQL endpoint + Databus dumps
Scope
English endpoint holds the Latest Core collection
Attribution
Keep DBpedia URIs visible and live
Cost
Free, rate limited
Licence
CC BY-SA 3.0 and GFDL

https://dbpedia.org/sparql

The public endpoint does not carry every DBpedia dataset — for the rest, pull from the Databus.

Conflicts and power stations in the historical atlas

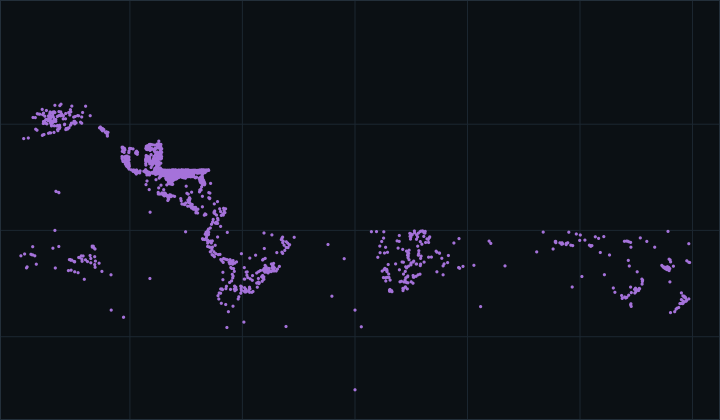
Violet points dense over Europe and the Caribbean, each a FactGrid item with coordinates
4,000 located items, capped by the query. The density follows what historians have loaded, which is why the Caribbean is as busy as Thuringia. FactGrid, CC0

SPARQL

FactGrid

A Wikibase for historical research, run by historians rather than by a general-purpose project. Same technology as Wikidata, its own property space, and records that go deeper into archival detail than a general encyclopedia would ever carry.

Run by
Gotha Research Centre, Erfurt, with Halle
Software
MediaWiki + Wikibase
Community
802 participants (May 2026)
Access
Query service, same SPARQL as Wikidata
Languages
Multilingual
Licence
CC0

https://database.factgrid.de/query/

Because the property space is its own, queries written for Wikidata do not transfer unchanged.

An independent history graph in the historical atlas

REST API

SCAR Composite Gazetteer of Antarctica

The authoritative place-name map of Antarctica, pooling the gazetteers of every nation that names features there — so one mountain can carry several official names at once, each with its own country and citation.

Coverage
Antarctica
Volume
39 187 names over 20 159 features
Maintained by
SCAR, through its geoinformation committee
Access
REST API from the British Antarctic Survey
Also
Per-country downloads from the AADC
Licence
CC BY, attribute the SCAR Secretariat

https://api.bas.ac.uk/locations/v1/gazetteer/cga

Names outnumber features because the same feature is named independently by different countries.

Part of the Antarctica set in the historical atlas

Direct download

Espacios Naturales Protegidos de España

Every protected area declared in Spain, in one file: national parks, natural parks, nature reserves, natural monuments, protected landscapes and marine protected areas. Ley 42/2007 defines five figures at state level; the autonomous communities add more than forty of their own, and all of them are in here.

Coverage
Spain, land and sea
Scale
1:50 000
Geometry
Area boundaries with their designation
Format
Shapefile 59.6 MB, or GML INSPIRE 61.9 MB
Updated
31 December 2025, reviewed yearly
Reuse
Free, attribution required

https://gis.miteco.gob.es/descargas/app/DescargaFichero?f=enp.zip

A zipped shapefile, so it is a conversion away from the canvas: ogr2ogr -f Parquet enp.parquet enp.shp gives you something the map reads in place. The yearly review is the point — boundaries move, new declarations land, and the file says which year it speaks for.

Attribution required when mapped: “Fuente: © Ministerio para la Transición Ecológica y el Reto Demográfico”.

Direct download

Red Natura 2000 en España

Spain's own cut of the Natura 2000 network: the sites of community importance and special areas of conservation from the Habitats Directive, plus the special protection areas for birds. Spain contributes more of this network than any other member state, so this is the file behind a great deal of European conservation mapping.

Coverage
Spain, terrestrial and marine
Contains
ZEC and LIC (habitats), ZEPA (birds)
Format
Shapefile 127 MB, or GML INSPIRE 127 MB
Updated
December 2024, as sent to the Commission
Also as
GeoJSON, GML and KMZ from the BDN pages
Reuse
Free, attribution required

https://gis.miteco.gob.es/descargas/app/DescargaFichero?f=rn2000.zip

The European card above covers the whole EU from the EEA. Take this one when you want what Spain itself submitted, on Spain's own update cycle, with the national codes on each site.

Attribution required when mapped: “Fuente: © Ministerio para la Transición Ecológica y el Reto Demográfico”.

Direct download

Inventario Español de Zonas Húmedas

The national wetland register: the marshes, lagoons, deltas and peatlands the state tracks so their condition can be followed over time and written into river basin plans. Small file, and the one to clip against when the question is whether something drained.

Coverage
Spain
Scale
1:50 000
Format
Shapefile, 4.38 MB
Updated
15 October 2025
Purpose
Feeds protection measures in water planning
Reuse
Free, attribution required

https://gis.miteco.gob.es/descargas/app/DescargaFichero?f=iezh.zip

At 4 MB this is the easiest of the Spanish set to convert and keep on the canvas permanently.

Attribution required when mapped: “Fuente: © Ministerio para la Transición Ecológica y el Reto Demográfico”.

Direct download

Humedales Ramsar de España

The Spanish wetlands listed under the Ramsar Convention as internationally important: marshes, estuaries, deltas and lagoons, each one a commitment the state made in a treaty rather than a line drawn at home.

Coverage
Spain
Designation
Ramsar Convention on Wetlands
Format
Shapefile 1.33 MB, or GML INSPIRE 3.81 MB
Updated
31 October 2025
Reuse
Free, attribution required

https://gis.miteco.gob.es/descargas/app/DescargaFichero?f=humedalesramsar.zip

Overlaps the national wetland inventory rather than duplicating it: Ramsar is the international designation, the IEZH is the domestic register.

Attribution required when mapped: “Fuente: © Ministerio para la Transición Ecológica y el Reto Demográfico”.

Direct download

Reservas de la Biosfera de España

The terrestrial and coastal areas UNESCO recognises under Man and the Biosphere. Spain holds one of the largest networks in the world, and unlike a park boundary these are zoned for people living and working inside them.

Coverage
Spain, terrestrial and coastal
Programme
UNESCO Man and the Biosphere
Format
Shapefile 1.6 MB, or GML INSPIRE 5.4 MB
Updated
31 December 2024
Reuse
Free, attribution required

https://gis.miteco.gob.es/descargas/app/DescargaFichero?f=reservasbio.zip

Worth pairing with the protected-areas file: a biosphere reserve usually contains several of them, and the interesting question is what sits in the buffer between.

Attribution required when mapped: “Fuente: © Ministerio para la Transición Ecológica y el Reto Demográfico”.

Direct download

Red General de Vías Pecuarias

The drovers' roads: the public network of cañadas, cordeles and veredas that moved livestock across Spain for centuries and is still, legally, public land. Read as ecology rather than history it is a corridor network — long, thin, continuous, and connecting habitats that roads and fields have otherwise cut apart.

Coverage
Spain, compiled with the autonomous communities
Geometry
Route network
Scale
Various
Format
Shapefile, 34.5 MB
Updated
31 December 2024
Reuse
Free, attribution required

https://gis.miteco.gob.es/descargas/app/DescargaFichero?f=VPecuarias.zip

Component 5f of the Inventario Español del Patrimonio Natural y la Biodiversidad. Scales vary because the source is each region's own classification work.

Attribution required when mapped: “Fuente: © Ministerio para la Transición Ecológica y el Reto Demográfico”.

Direct download

Regiones Biogeográficas de España

The biogeographic regions Spain is divided into for the Habitats Directive: Atlantic, Mediterranean, Alpine and Macaronesian. The layer that explains why the same habitat code means something different in Galicia and in Almería, and the one conservation status is assessed within.

Coverage
Spain, including the Canary Islands
Regions
Atlantic · Mediterranean · Alpine · Macaronesian
Used for
Reporting under the Habitats Directive
Format
Shapefile
Reuse
Free, attribution required

https://gis.miteco.gob.es/descargas/app/DescargaFichero?f=regionesbio.zip

Small and slow-changing, which makes it a good permanent backdrop to clip other Spanish layers against.

Attribution required when mapped: “Fuente: © Ministerio para la Transición Ecológica y el Reto Demográfico”.

Direct download

Áreas Importantes para las Aves (IBA)

The Important Bird and Biodiversity Areas identified in Spain: sites that matter for bird populations on ornithological criteria rather than administrative ones. They are not a legal designation, which is exactly why they are useful — the gap between an IBA and the nearest ZEPA is a question worth asking.

Coverage
Spain
Basis
BirdLife criteria, identified by SEO/BirdLife
Status
Scientific inventory, not a legal designation
Format
Shapefile
Reuse
Free, attribution required

https://gis.miteco.gob.es/descargas/app/DescargaFichero?f=iba.zip

Published through the Banco de Datos de la Naturaleza; the underlying inventory is SEO/BirdLife's work, so cite both when you use it.

Attribution required when mapped: “Fuente: © Ministerio para la Transición Ecológica y el Reto Demográfico”.

WMS service

IGN base map (WMS)

Spain's national base cartography, served as a Web Map Service. Paste the URL with a layers= parameter and the canvas tiles it directly — no download, no conversion, and no proxy: the server renders each tile and MapLibre asks for them as you pan.

Coverage
Spain
Served by
Instituto Geográfico Nacional
Protocol
WMS 1.3.0, EPSG:3857
Layer
IGNBaseTodo
CORS
Open
Licence
CC BY 4.0 (attribution required)

https://www.ign.es/wms-inspire/ign-base?service=WMS&layers=IGNBaseTodo

A WMS gives you pixels, not features — you can see it and place things against it, but you cannot query or analyse what is in it. That is the trade for reaching data nobody has converted.

Attribution required when mapped: “Instituto Geográfico Nacional de España”.

WMS service

OpenStreetMap as a WMS

The whole OSM base map, rendered by terrestris and served as WMS. Useful as a backdrop where the built-in basemaps are too dark or too sparse, and as the simplest thing to test a WMS paste against — it answers in Web Mercator with open CORS, which is what makes a service usable from a browser at all.

Coverage
Global
Served by
terrestris GmbH
Protocol
WMS 1.3.0, EPSG:3857
Layer
OSM-WMS
CORS
Open
Licence
ODbL — © OpenStreetMap contributors

https://ows.terrestris.de/osm/service?service=WMS&layers=OSM-WMS

Both of these were pasted into the canvas and tiled before they were written down here, which is the only way to know a service answers a browser rather than only a desktop GIS.

Two of these look at the same forest. The Sentinel-2 quicklook and the Natura 2000 card both show Białowieża, one of the last large lowland primary forests in Europe, which is a decent test of whether a dataset can tell old growth from plantation.

Get early access to the catalog